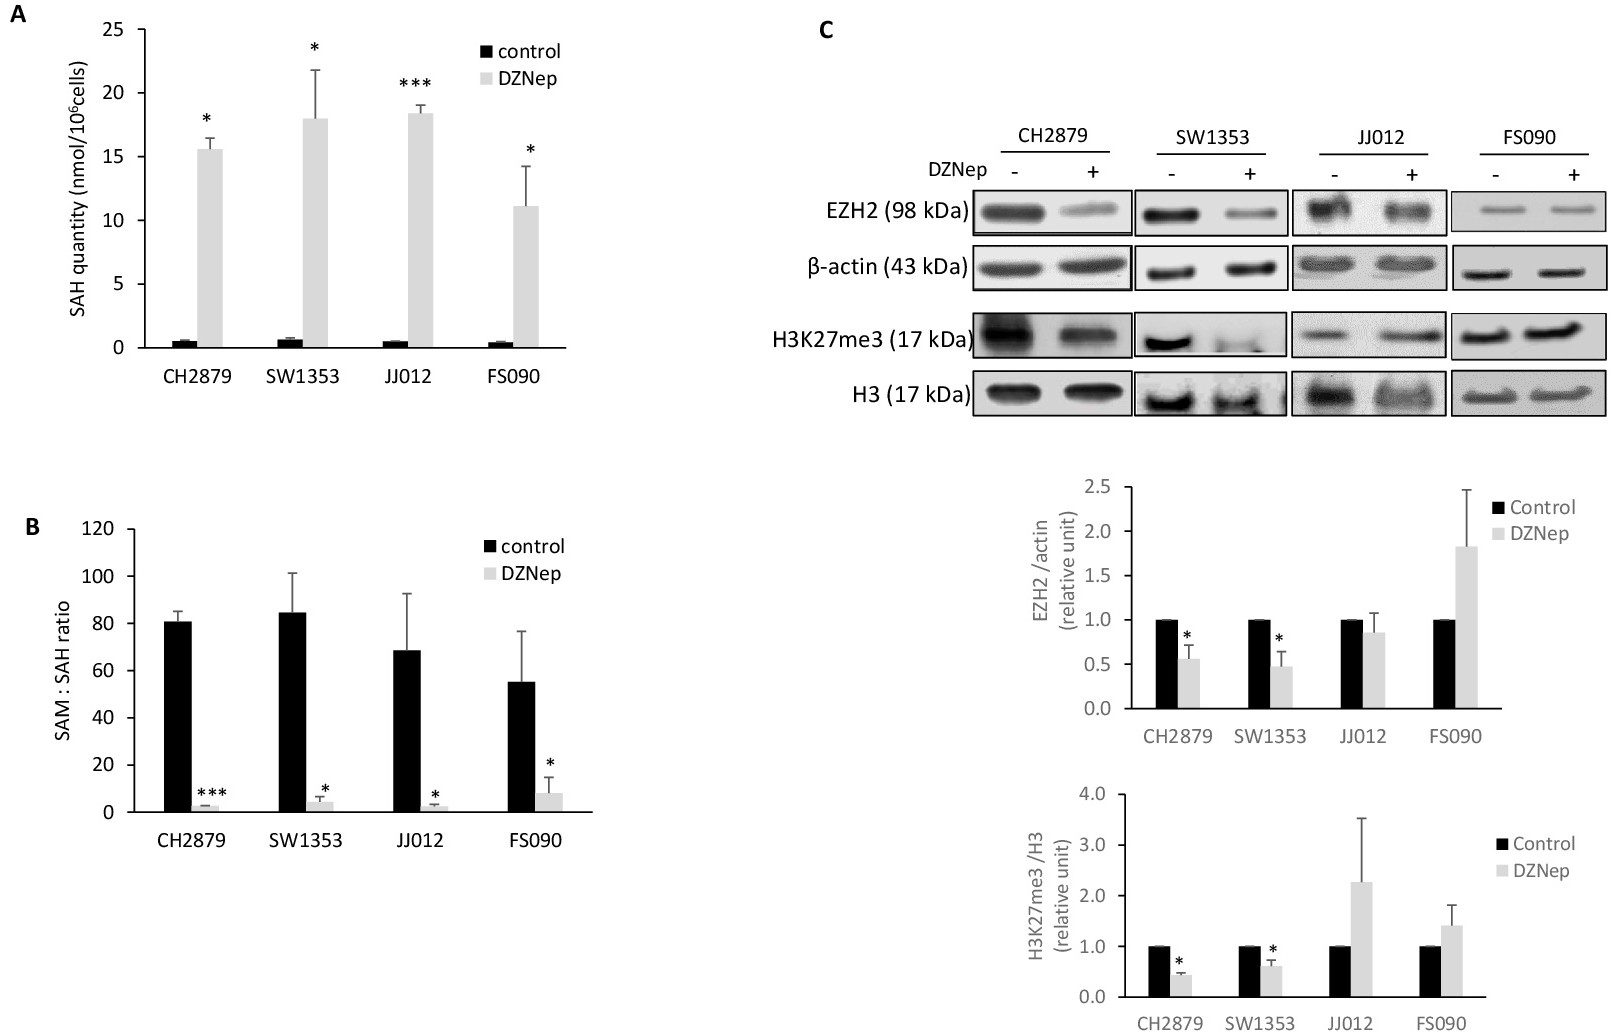
Fig. 4. DZNep induced SAH accumulation but not EZH2 inhibition in CS (A-B) SAH and SAM assayed in cells after 24h-treament with DZNep (1µM). SAH concentration (A) and SAM:SAH ratio (B) were are shown. Means + SEM are shown (n=3). (C) EZH2 protein expression or H3K27me3 levels were analyzed by Western blot in DZNep treated-cells. β-actin and H3 were used to compare protein loading for EZH2 and H3K27me3 respectively. Representative Fig.s of three independent experiments are shown. Histograms represent the relative quantification of EZH2/actin signals and H3K27me3/H3 signals. Data are expressed as means + SEM (n=4).*: p-value < 0.05.